August 10,
2015 by in General 

2015 Q2 year to date totaled $45.23 billion, an increase of 5.4 percent over the first two quarters of last year. Industry sales are on pace to finally reach or surpass peak pre-recession totals.
August 3,
2015 by in General, Relevant

The chart above shows quarter-over-quarter industry performance from 2012 Q2 through the second quarter of 2015.
Second quarter combined Furniture and Bedding industry sales of $22.96 billion were a 5.2 percent improvement over $21.83 billion from the same quarter in 2014. Compared to last quarter (2015 Q1) sales improved 3.1 percent
Furniture (excluding Bedding) increased 5.2 percent in 2015 Q2 versus the same quarter last year with sales of $19.67 billion – up from $18.7 billion in 2014 Q2.
Bedding continued steady quarter-over-quarter growth with sales of $3.28 billion, up 4.9 percent over second quarter sales last year.
July 24,
2015 by in General

The Industry continued its steady growth in the second quarter of this year. A 5.2 percent increase over the same quarter last year resulted in Furniture and Bedding sales totaling $22.96 billion. Compared to the previous 1st quarter of this year, sales were 3.1 percent.
Furniture (excluding Bedding) increased 5.2 percent over 2014 Q2 and grew 4.3 percent over the previous Q1 of this year. Bedding sales were also up 4.9 percent over Q2 of last year but declined 3.4 percent compared to the previous quarter (2015 Q1).
July 20,
2015 by in General

This is the fifth in a series of five Factoids detailing Consumer Spending. Consumers are spending an increasing amount of money on Consumer Services and “Lifestyle Expenditures” – leaving fewer dollars for Furniture and other durable and non-durable goods.
Factoid #5 compares the dollar growth in personal consumption of three major home furnishings consumer products - Furniture, Major Household Appliances, and Televisions.
The innovation in Televisions has been the major home furnishings consumer expenditure story early on, growing from 13.1 percent of the home furnishings category to 21.5 percent over the 15-year period.
The Television industry has more than doubled since 2000, growing 141 percent. However, most of that growth occurred before and during the recession. Since the recession, the Furniture industry has outperformed both Televisions and Appliances, growing 20 percent since 2009 compared to 9 percent for Appliances and 4 percent for Televisions.
Source: U.S. Department of Commerce, Bureau of Economic Analysis “Personal Consumption Expenditures”
July 13,
2015 by in General
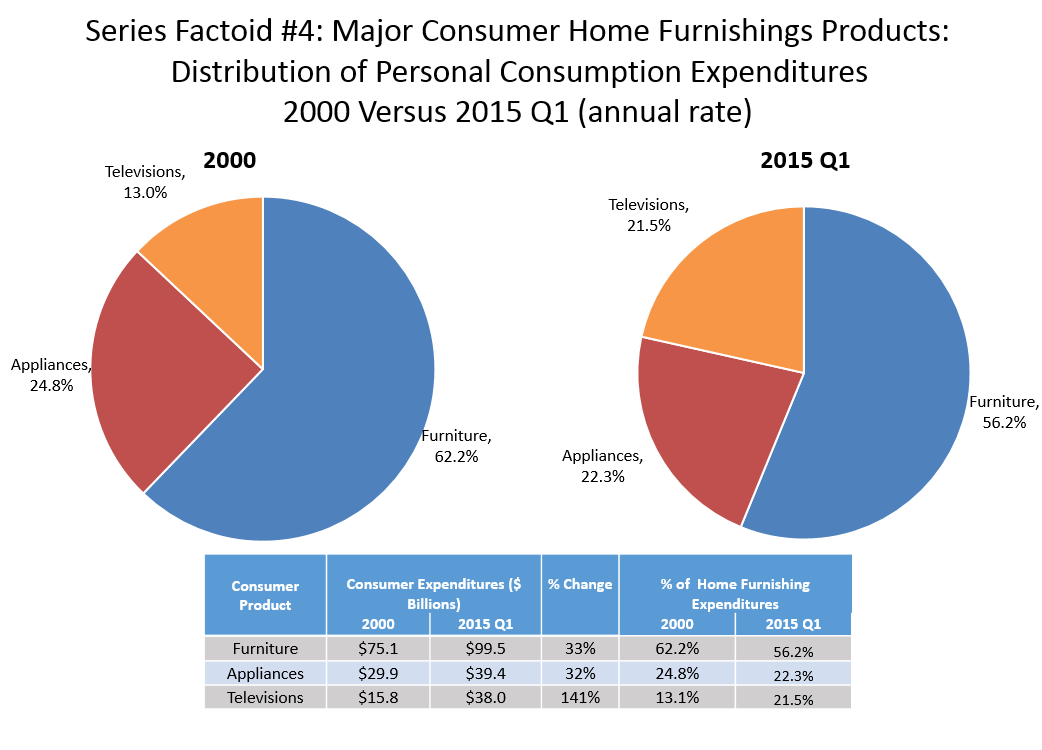
Factoid #4 details the Furniture industry’s growth in share of the three major home furnishings product categories – Furniture, Major Household Appliances, and Televisions. Furniture has lost share over the last 15 years, slightly to Major Appliances, but sharply to the rapid innovation in Televisions
Furniture and Bedding continues to claim the largest share of the three home furnishings product categories at 56.2 percent but has lost six market share points, primarily to televisions. Since 2000, total personal consumption of furniture products has grown 33 percent (2015 Q1 annual rate) to $99.5 billion, just above the growth rate of appliances.
Appliances have also lost market share slightly to Televisions, falling from 24.8 percent to 22.3 percent between 2000 and 2015 Q1. In terms of growth, the $39.4 billion Major Appliance industry has the lowest rate of the three home furnishings categories at 32 percent.
Source: U.S. Department of Commerce, Bureau of Economic Analysis, “ Personal Consumption Expenditures”
July 6,
2015 by in General

This is the third in a series of five Factoids detailing Consumer Spending. Consumers are spending an increasing amount of money on Consumer Services and “Lifestyle Expenditures” – leaving fewer dollars for Furniture and other durable and non-durable goods.
Consumers were faced with increasing costs of Housing and Healthcare on smaller budgets during the Great Recession. Factoid #3 shows the rise of Consumer Services expenditures from 2000 to 2015Q1. Like Housing, Healthcare expenditures have grown exponentially - increasing 126 percent in 15 years. Although dropping slightly in 2009, money spent on Food Services and Accommodations and Recreation increased by 93 percent and 77 percent. Consumers decreased spending on Transportation during the recession by 7 percent, but have grown 21 percent since 2009.
The final two factoids in this series will show how as the economy recovers and budgets increase, sales of home furnishing products are rising alongside Consumer Services expenditures.
June 29,
2015 by in General

This is the second in a series of five Factoids detailing Consumer Spending. Consumers are spending an increasing amount of money on Consumer Services and “Lifestyle Expenditures” – leaving fewer dollars for Furniture and other durable and non-durable goods.
Money spent on Housing, including rent, utilities and other vendor services related to housing costs, has risen at a rapid pace since 2000 – up 85.6 percent in 2015 Q1 while consumption of Furniture rose just 33.3 percent.
Unlike Furniture, which felt the impact of the Recession – dropping 11 percent in 2009, Housing services expenditures only slowed its upward momentum. On a positive note, Furniture has risen 20 percent since the peak of the recession, while Housing increased 18 percent.
Source: U.S. Department of Commerce, Bureau of Economic Analysis, “Personal Consumption Expenditures”
June 18,
2015 by in General

This is the first in a series of five Factoids detailing Consumer Spending. Consumers are spending an increasing amount of money on Consumer Services and “Lifestyle Expenditures” – leaving fewer dollars for Furniture and other durable and non-durable goods.
Consumer demand for Services (mostly housing expenses and utilities as well as healthcare) have increased their share of personal consumption expenditures over the last 15 years as Furniture (falling under the Durable Goods category) has decreased.
This Factoid shows the shifting of Goods and Services from 2000 to 2015 Q1. Services added 3.7 percent to its share of personal consumption, while Durable Goods, including home furnishings, motor vehicles, appliances, televisions etc., fell 2.5 percentage points. Non-durable goods, like food and clothing, as a group also lost 1.7 percentage points.
Source: U.S. Department of Commerce, Bureau of Economic Analysis, “Personal Consumption Expenditures”
June 15,
2015 by in General
This is the fourth factoid in a series detailing the Furniture Industry’s Distribution Channels. Factoid #4 shows the percentage of products sold in each distribution channel.
Furniture and Home Furnishing Stores. Traditional furniture stores along with specialty furniture retailers and home furnishings stores sold almost equal amounts of Upholstery (35.9%) and Living Room, Dining Room, and Bedroom (32.7%). Bedding is also a staple item in this channel at 23.2% of Furniture and Bedding sales, while there were fewer sales of Home Office and Computer Related (5.2%) and Outdoor and Patio (3.0%).
Electronic Shopping (Internet). Although the highest percent of Furniture and Bedding sales in Electronic Shopping belongs to Living Room, Dining Room, and Bedroom Furniture at 32.7%, the other 4 main products are all between 14.0% and 19.1% of this distribution channel’s total sales. The distribution of sales of each main furniture category is the most balanced in the Electronic Shopping.
Warehouse Clubs and Supercenters. These big box stores sell a mix of Home Office and Computer Related (36.1%), Living Room, Dining Room, and Bedroom (35.3%), and Outdoor and Patio (25.7%). Very little Bedding (1.7%) and Upholstery (1.2%) is sold through this channel.
General Merchandise Stores. The five main furniture categories are well distributed in General Merchandise Stores with Upholstery being the majority at 34.7% and the exception of Home Office and Computer Related Items only contributing 2.8% of sales.
Discount Department Stores. The vast majority of Discount Department Store furniture and bedding sales occur in the Living Room, Dining Room, and Bedroom category at 86.5%. Outdoor and Patio are 10.4% of sales, while the remaining products are 3.1% combined.
Home Centers. Outdoor and Patio furniture is mostly sold in Home Center and Other Building Material stores – accounting for 56.2% total furniture and bedding sales in this channel. The channel also sold 20.8% in Living Room, Dining Room, and Bedroom and 14.5% in Home Office and Computer Related items.
Department Stores. Bedding is still the largest segment of furniture products sold in Department Stores at 56.3% of product mix.
Other product mixes include 17.5% of sales in Upholstery, 15.8% in Living Room, Dining Room, and Bedroom, and 10.3% in Outdoor and Patio.
June 5,
2015 by in General

This is the third factoid in a series detailing the Furniture Industry’s Distribution Channels. Factoid #3 determines the percent of sales of a product by each main distribution channel.
Upholstery. The vast majority of Upholstery is sold in Furniture and Home Furnishing Stores– 83.9% in 2012. 8.6% was sold through Electronic Shopping, while General Merchandise stores accounted for 4.2% of Upholstery Sales. The remaining distribution channels each made up less than 1.5%.
Casegoods. With 60.4% of Living Room, Dining Room, and Bedroom Furniture Sales, Furniture and Home Furnishing Stores are the primary distribution channel for these products. 14.4% are also sold through Electronic Shopping, while 7.0% sells in Discount Department Stores and 4.0% in Warehouse Clubs and Supercenters.
Home Office and Computer. The primary source of Home Office and Computer Related Sales are divided between Furniture and Home Furnishing Stores at 35.3%, Electronic Shopping at 31.0% and 15.1% sold in Warehouse Clubs and Supercenters.
Outdoor and Patio. The majority of Outdoor and Patio sales were sold online making Electronic Shopping 33.8% of distribution. 23.0% of sales occurred in Furniture and Home Furnishing Stores, 15.0% in Home Centers and Other Building Materials, 11.9% in Warehouse Clubs and Supercenters and 9.4% in General Merchandise Stores.
Bedding. Like Upholstery, Bedding is mainly sold in Furniture and Home Furnishing Stores, which include Specialty Bedding Stores, with 78.2% of sales, followed by Electronic Shopping at 11.5% and Department Stores at 5.8%.
Source: Figures reflect data from the U.S. Census of Retail Trade issued every 5 years – 2002, 2007, and 2012. Figures for 2014 have been estimated by Impact Consulting Services’ furniture industry model.