May 13,
2016 by in General 

This is the first factoid in a series of four factoids detailing the Furniture Industry’s recovery from the Recession to finally meet and exceed pre-recession peak sales of 2007. The majority of the positive growth in 2015 occurred in large Metropolitan Statistical Areas (MSA’s), while many Micropolitan Statistical Areas (Micro SA’s) and Rural Areas are still struggling to make a full recovery.
The Furniture Market trudged through eight years of recession and slow growth to finally dig out and surpass the performance in 2007. The industry plummeted 17.4 percent in two years, but it took another six years to recover and grow 24.4 percent to sales of $92.2 Billion in 2015.
In both 2007 and 2015, MSA’s control 90.6 percent of industry sales with smaller Micropolitan Statistical Areas totaling 6.2 percent and the remaining 3.2 percent spread among the rural areas. All three market types are now above 2007 levels. MSA’s took a nosedive in 2009 – dropping 17.7 percent as Micro SA’s and Rural Areas decreased 14.4 and 13.6 percent. While the larger markets had the greatest declines, they have also made the biggest comeback – growing 24.8 percent in comparison to 20.4 percent and 20.9 percent in the smaller markets and rural areas.
Source: Impact Consulting Services Proprietary Model
Sales analysis is provided by Impact Consulting Services, Inc., Atlanta, Georgia and is part of a proprietary model that tracks retail furniture and bedding sales at the market level. Sales include bedding, upholstery, bedroom, dining room, occasional, outdoor, and other miscellaneous furniture items. Sales tax is excluded. Data for all years is calculated based on current market geographical boundaries.
May 6,
2016 by in General
Industry Sales by Quarter 2009 Q1 to 2016 Q1 (Preliminary) Bedding Industry

Bedding sales in the first quarter of this year grew 5.1 percent over the same Q1 in 2015 totaling an estimated $3.56 billion. Compared to the last quarter (2015 Q4) which is traditionally Bedding’s lowest performing period, sales were up 16% percent.
Industry Growth Quarter to Quarter 2013 Q1 to 2016 Q1 (Preliminary) Bedding Industry

After a poor fourth quarter last year, Bedding sales in the first quarter of 2016 were up 5.1 percent quarter over quarter totaling $3.56 billion.
Industry Sales 2008 to 2016 Q1 (Preliminary) Bedding Industry
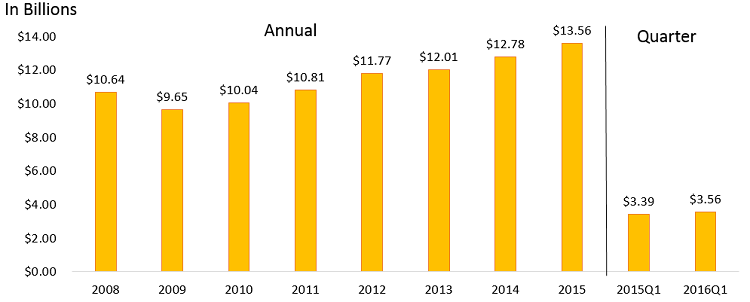
First quarter Bedding sales totaled $3.57 billion, up 5.1 percent from the same quarter last year.
April 29,
2016 by in General
Industry Sales by Quarter 2009 Q1 to 2016 Q1 Furniture & Bedding

The Industry experienced its customary first quarter dip compared to last quarter with sales down 2.2 percent 2016 Q1 versus 2015 Q4. However, compared to the same quarter last year (2015 Q1), sales were up 4.2 percent totaling $23.06 billion.
Furniture (excluding Bedding) increased 4.2 percent in the first quarter over 2015 Q1. First quarter sales fell 4.9 percent below last quarter (2015 Q4).
Bedding sales were also up 5.1 percent over Q1 of last year. Compared to the last quarter (2015 Q4) which is traditionally Bedding’s worst quarter, the first quarter grew 16 percent.
Industry Growth Quarter to Quarter 2013 Q1 to 2016 Q1 Furniture & Bedding

The chart above shows quarter-over-quarter industry performance from 2013 Q1 through the first quarter of 2016.
First quarter combined Furniture and Bedding industry sales of $23.06 billion were a 4.2 percent improvement over the same Q1 in 2015. Compared to last quarter (2015 Q4) sales declined 2.2 percent.
Furniture (excluding Bedding) increased 4.1 percent in 2016 Q1 versus the same quarter last year with sales of $19.5 billion – up from $18.74 billion in 2015 Q1.
Bedding quarter-over-quarter sales of $3.56 billion, up 5.1 percent over first quarter sales last year.
Industry Sales 2008 YE to 2016 Q1 Furniture & Bedding

Industry sales in the first quarter of 2016 totaled $23.06 billion, an increase of 4.2 percent over the first quarter of last year.
April 22,
2016 by in General
The Fall and Slow Rise of Home Furnishing Retail Stores Percent Shift in Home Furnishings Retail Store Characteristics 2007 vs. 2012

This is the third factoid in a series of five factoids detailing how hard Home Furnishings retail stores were hit across the country during the Recession. The furniture industry suffered greatly due to the collapse of the housing industry and the high unemployment rate. And it has been one of the slowest to dig out. While current data is maintained by the Bureau of Labor Statistics for the broad Home Furnishings category, data from the recent Geography release from the 2012 Economic Census shows the impact of the recession on the store types -- Furniture Stores, Home Furnishings Stores, and Floor Covering Stores.
The data shows that for Furniture and Floor Covering Stores, not only were the store closures significant, but remaining locations also cut back on employees. Furniture stores lost 18 percent of locations, Home Furnishings stores 23.8 percent and Floor Covering stores 21.7 percent.
The Fall and Slow Rise of Home Furnishing Retail Stores Percent Shift in Number of Establishments by Region 2007 to 2012

This is the fourth factoid in a series of five factoids detailing how hard Home Furnishings retail stores were hit across the country during the Recession. The furniture industry suffered greatly due to the collapse of the housing industry and the high unemployment rate. And it has been one of the slowest to dig out. While current data is maintained by the Bureau of Labor Statistics for the broad Home Furnishings category, data from the recent Geography release from the 2012 Economic Census shows the impact of the recession on the store types -- Furniture Stores, Home Furnishings Stores, and Floor Covering Stores.
Although store closings were systemic across the country, the Northeastern and the Western states were the hardest hit. Compared to a loss of 13.4 percent of Furniture stores in the South, the West almost doubled that percentage closing 26.2 percent. Meanwhile Floor Covering Stores closed the most doors in the Midwest, 26.7 percent.
The Fall and Slow Rise of Home Furnishing Retail Stores Percent Shift in Number of Establishments and Employees by Store Type and Market Size 2007 vs. 2012

This is the final factoid in a series of five factoids detailing how hard Home Furnishings retail stores were hit across the country during the Recession. The furniture industry suffered greatly due to the collapse of the housing industry and the high unemployment rate. And it has been one of the slowest to dig out. While current data is maintained by the Bureau of Labor Statistics for the broad Home Furnishings category, data from the recent Geography release from the 2012 Economic Census shows the impact of the recession on the store types -- Furniture Stores, Home Furnishings Stores, and Floor Covering Stores.
Metropolitan Statistical Areas (MSA), Micropolitan Statistical Areas (Micro SA), and Rural Areas all experienced widespread store closures, employee reductions, and decreases in annual payroll 2007 to 2012. Looking at the impact of store closings on markets by industry size, mid-sized markets (under $100 million) tended to fare only slightly better than large markets with over $100 million in industry sales or small Micropolitan Statistical Areas. Furniture Store closing were the least impacted with mid-sized markets faring the best, but still closing 16.1 percent of stores during the 2007 to 2012 period. Meanwhile over 27 percent of Floor Covering stores closed in Micropolitan Statistical Areas.
Furniture Stores were forced to cut almost 30 percent of employees across all markets from 2007 to 2012. Floor Covering Stores had the highest percentage of employee cutbacks - the largest occurring in Micropolitan Statistical Areas with a 38.1 percent drop. Home Furnishing Stores suffered the least amount of employee loss – most likely due to a wider variety of non-furniture merchandise as well as typically smaller store sizes.
April 15,
2016 by in General

This is the second factoid in a series of five factoids detailing how hard Home Furnishings retail stores were hit across the country during the Recession. As a whole the Furniture and Home Furnishings business lost 18 percent of its stores and data from the U.S. Department of Commerce, Bureau of Labor Statistics shows the number of employees falling 23.6 percent and average hourly earnings decreasing 0.9 percent. Since 2012, the total industry has seen another 3.6 percent loss in stores. However both employment and hourly wages have improved, 6.1 percent and 9.3 percent respectively, signaling an ever-so-slow rebound.
Index Growth in this factoid shows the rapid reduction of stores during the Recession with the total Furniture and Home Furnishings industry dropping from almost 61,000 stores to 48,000 between 2007 and 2015.
Despite the continued loss of stores, hiring is picking up. Although not back to pre-recession levels, the number of employees is steadily increasing from 2012 – up 6.1 percent in 2015. In 2015 the industry employed 465,000 workers, down from 574,000 in 2007.
While average hourly earnings dipped -0.9 percent from 2007 to 2012, wages increased 9.3 percent since 2012 to $19.37– 2015 now exceeding pre-recession (2007) average earnings.
Source: U.S. Department of Commerce, Bureau of Labor Statistics
April 8,
2016 by in General

This is the first factoid in a series of five factoids detailing how hard Home Furnishings retail stores were hit across the country during the Recession. Newly released detailed geography data from the Economic Census conducted throughout 2012 shows that all types of Home Furnishing establishments closed a multitude of stores from 2007 to 2012. No area of the country was left unscathed.
As a whole the Furniture and Home Furnishings business lost 18 percent of its stores and data from the U.S. Department of Commerce, Bureau of Labor Statistics shows the number of employees falling 23.6 percent and average hourly earnings decreasing 0.9 percent. Since 2012, the total industry has seen another 3.6 percent loss in stores. However both employment and hourly wages have improved, 6.1 percent and 9.3 percent respectively, signaling an ever-so-slow rebound.
Source: U.S. Department of Commerce, Bureau of Labor Statistics
April 1,
2016 by in General

This is the final factoid in a series of four factoids exploring the growing trend among seniors called “Aging in Place.” On average, 10,000 people are turning 65 every day. By 2030, one in five people will be 65 and over. Now facing decisions on where and how to spend their aging years, a majority of these early Baby Boomers want to stay in their homes.
This has spawned an entire remodeling industry that includes construction to modify and retrofit homes for safety and convenience as well as interior design geared to the aging – including furniture, flooring, and lighting.
The Joint Center for Housing Statistics of Harvard University (JCHS) did extensive research from 2003 to 2013 that shows a rapidly increasing percentage of the remodeling industry is from seniors already or planning to “age in place. “
The 65+ age group jumped 67.1 percent in home improvement expenditures over 10 years, while ages 55 to 64 grew by 33.9 percent - together accounting for over 47 percent of total home improvement expenditures in 2013. Ages 35 to 44 and 45 to 54, traditionally the bread and butter of the remodeling industry, collectively dropped their share of total home improvement expenditures by 37.8 percent from 2003 to 2013 partly due to recessionary factors and partly due to their lower population numbers.
Source: Joint Center for Housing Statistics of Harvard University (JCHS)
March 24,
2016 by in General

This is the third in a series of four factoids exploring the growing trend among seniors called “Aging in Place.” On average, 10,000 people are turning 65 every day. By 2030, one in five people will be 65 and over. Now facing decisions on where and how to spend their aging years, a majority of these early Baby Boomers want to stay in their homes.
This has spawned an entire remodeling industry that includes construction to modify and retrofit homes for safety and convenience as well as interior design geared to the aging – including furniture, flooring, and lighting.
Seniors today are more active and affluent than any generation before them. Of the 46 million Baby Boomers, about 25 percent of them have annual incomes of $100,000 or more and a net worth of $400,000 or more. Currently, households over 65 have average net worth’s almost double that of younger households.
According to The Demand Institute, 40 percent of households in the U.S. are headed by someone between the ages of 50 and 69 and this group holds 54% of all household wealth. As this group ages into retirement, more money will go toward the home improvement industry.
Source: U.S. Census Bureau
March 18,
2016 by in General

This is the second in a series of four factoids exploring the growing trend among seniors called “Aging in Place.” On average, 10,000 people are turning 65 every day. By 2030, one in five people will be 65 and over. Now facing decisions on where and how to spend their aging years, a majority of these early Baby Boomers want to stay in their homes.
This has spawned an entire remodeling industry that includes construction to modify and retrofit homes for safety and convenience as well as interior design geared to the aging – including furniture, flooring, and lighting.
According to a 2014 survey by the American Association of Retired Persons (AARP) depicted on Table B, nearly 90 percent of seniors want to stay in their own homes as they age. When asked if they preferred to stay in their homes even while needing day-to-day assistance or ongoing healthcare during retirement, 82 percent answered yes. Only 9 percent actually prefer to move to a retirement or assisted living community and 4 percent opt for moving to a relative’s home.
Results of the U.S. Aging Survey by the National Council on Aging show that 58 percent of householders over the age of 60 have not changed residences in more than 20 years. 75 percent say they intend to live in their current home for the rest of their lives and many have already began home improvements. Thirty-four percent have made bathroom upgrades and 28 percent have improved lighting. Seniors are methodically using their money to ensure independence and safety in their retirement years.
Source: American Association of Retired Persons (AARP) 2014 Survey
March 11,
2016 by in General

This is the first factoid in a series of four factoids exploring the growing trend among seniors called “Aging in Place.” On average, 10,000 people are turning 65 every day. By 2030, one in five people will be 65 and over. Now facing decisions on where and how to spend their aging years, a majority of these early Baby Boomers want to stay in their homes.
This has spawned an entire remodeling industry that includes construction to modify and retrofit homes for safety and convenience as well as interior design geared to the aging – including furniture, flooring, and lighting.
Senior homeowners remain key to the U.S. economy with Baby Boomers now entering their retirement years. In the last 10 years alone, the population 65 and over group has grown almost 30 percent and many have adopted the “Aging in Place” philosophy.
As shown in Table A, the number of householders age 65 and over is expected to grow to 56 million in 2020. From 2015 to 2030, this age group should increase over 52 percent – jumping to 73 million. At a projected 84 million by 2050, 20 percent of the population will be 65 and over.
Source: U.S. Census Bureau, 2014 Population Projections