Monthly Issue
From Home Furnishing Business
The Sales Game
May 19,
2016 by in Financial Reports, Industry 
As the traditional Mom and Pop furniture distribution channel matured shrinking into an ever-narrowing product offering, forsaking categories such as small appliances and housewares, retailers began to lose traffic. Each move resulted in fewer reasons for the consumer to come into the store and discover that bedroom group that they couldn’t live without. Even famed “dirty window stores” with their weekly payment plans have disappeared, in part, because of the regulations. For the most part, however, it was the transfer of our credit purchases to a third party credit card. Lost forever is the astute sales manager who knew exactly when the final payment was close and created an opportunity for the next purchase.
However, the one thing that has not changed is the old adage “Nothing happens until you sell something.” While some of the Mom and Pop stores have grown to regional chains, the one statistic senior management knows is the percentage of sales up or down compared to the same week last year.
What is true is a furniture retailer needs sales to prosper. Like all retailing, there is a fixed cost required to select (merchandise), present (store design/maintenance), sell (sales management) and deliver the product to the consumer. This fixed cost must be recouped before the first dollar of profit is secured. The next element is gross margin that can be achieved above the cost of the product delivered to the retailer’s store. While many retailers become entrenched in a pricing formula (keystone) which simplifies the pricing, this removes the opportunity to achieve the value of the product. From this gross margin must be subtracted the variable costs, such as sales commission, incremental delivery, and warehousing. There are also opportunities for improving the variable cost with reductions for delivery charges and protection sales. With all of these elements it comes down to what your breakdown as calculated below.

In other words, this revenue (breakeven) is what level of sales must be achieved before a profit is made. In the past the importance of the Fourth Quarter and “Black Friday” to retailers was well understood. However, in furniture, revenue has leveled out, removing the peaks caused by “tax refunds” and “crops in” facilitated by the fact that most consumers have the credit cards in their pockets. For furniture retailing this has been a negative because many smaller purchases can jump in front of the consumer’s planned redecorating project.
It's a Different Shopping World
Before the late 1990s, shoppers learned about products, trends and decorating ideas through very limited means compared to today’s standards. There were fewer than a dozen color home furnishings magazines available for ideas, such as House & Garden, Metropolitan Homes and House Beautiful.
Local stores were the best places to go for style ideas and furnishings ideas. For many, the stores were the only options. Shoppers often visited five to seven stores to uncover ideas for their homes, find the product they wanted and pay the price they could afford.
In the late 90s, the technology for cheaper production of color advertisements and magazines became available. The first cable home decorating and home improvement shows were created. Then came the Internet, where consumers could research style trends, products, services and pricing. Suddenly, consumers had a virtual library where they could educate themselves about home furnishings.
Today, consumers are time-constrained. At least 75 percent get information from the internet before visiting a retail store. They also seek the advice of friends. They make many decisions before they shop, including what store to visit first. Many now forego the store completely and buy online. Those who do shop in a brick and mortar store will typically end up visiting slightly more than two locations before making a purchase.
What are the obstacles?
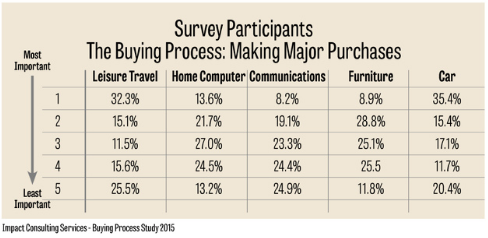
The first and most challenging effort is to get the consumer to allocate his or her disposable income to the furniture purchase. For years the fascination with the telephone (communication) and computers diverted the consumer’s expenditures from furniture. As can be seen in the following graphic, the consumer’s awareness may be turning. With an inspired consumer who is motivated to purchase, they begin the shopping process. There is not one way, but many paths to the end game. The following table presents the most common route to making a purchase.

Why Buy?
Buying furniture is not like a trip to the market for bread or milk; it’s not like a day at the mall to buy clothes for the family; and it’s not even like the purchase of a car. So what are the reasons for the consumer to purchase furniture? As one might expect, the highest percentage of purchases (38.1%) are made to replace current furniture. This reason is not surprising since furniture is a product that the family lives with every day of the year often going unnoticed by the daily users, suffering silently under the onslaught of animals, bouncing children, and spilled snacks.
After furniture replacement, the other most frequently mentioned reasons to make a furniture purchase were the desire for new furniture (31.3%), a recent move (26.8%), and redecorating (20.6%). The following graphic summarizes the other reasons.

Pre-purchase Shopping
The consumers were asked specific questions about their shopping experience. The following graphics present these findings. It is important to remember that what the consumer considered “shopping time” was most likely time spent in the stores looking at product. It is probable that the time spent researching the product, such as looking at product online or on a specific company website, was not included. Assuming that this is the time in the stores, the consumer did not spend a very long period before making his or her selection. The most frequent time period in this pre-purchase phase was two weeks to one month (27.5%) followed by the 1 to 2 weeks period (26.3%).

Number of Retailers Shopped Before Purchase
The average number of retailers that the consumers shopped is another indication of the pre-shopping mode the consumer was in. The highest percentage of shoppers only visited three retailers (38.3%) with an additional 23.7% of shoppers who only shopped two stores. This is indicative of a consumer who has done some pre-shopping “homework” before entering the furniture stores. On average the consumer shopped two stores. Now that the consumer is in the store the sales team is in play.

The Role of the Retail Sales Associate
When educated consumers come through the door of the retail store armed with research they have a clear picture of what they want. They are much more confident about selecting products for their home than were consumers in the 90s. They tend to think they don’t need the help of a sales person and are more inclined to say they are “just looking” even when they are actually looking for something.
This creates an issue for the sales associate who is usually on an ups program, working on commission (as does 90% of the industry). When he greets the shopper at the door, he gets the brush-off by a consumer who wants to browse. The problem is, most furniture retail stores are not like a grocery store, where one can walk through and see all there is to offer. Even if it was, people only “see” about 15-20 percent of what is in a store when they visit.
Keep in mind that, unlike the past, most shoppers who come through the door are there because they narrowed their choices and they came to your store. Therefore, it is crucial for sales associates to connect with every shopper who enters the store, even when they say they’re “just looking.” Include training that addresses creative ways of engaging customers and developing a relationship.
Because consumers approach the shopping and buying process very differently than they did 10 or even five years ago doesn’t it make sense that we may need to change the way we sell in order to be more successful at helping consumers? In addition, most younger employees don’t like the model, and the millennials coming through your door don’t like it either. You must have people on staff who understand, and can sell to, the newest generation of shoppers.
How Do You Keep Score?
The challenge of a retailer is to manage the retail sales associates, mentoring the new trainee to close the sale and the more seasoned associate to “build the ticket.” The following table shows the impact of incremental change in either.

Whenever the problem is, you ultimately end up at this chart. Why? Because sales is the only game.
WHAT ARE THE KEY PERFORMANCE INDICATORS?
Everyone knows the foundation of management is the establishment of method to measure results. The furniture product requires some interaction between the consumer and a knowledgeable individual - the retail sales associate (RSA). The ongoing discussion in the industry is how to define “knowledgeable.” The IKEA sales associate is available to answer questions with a staffing ratio of one sales associate to 2000 visiting consumers each month. IKEA’s much touted point of sale does the selling. Compare this to the upper end store staffed with retail sales associates who have design experience at a ratio of 1 to 60 monthly customers (Ups).
Sales Management on the floor, often unappreciated, is the key to performance. Maintaining a selling staff today is a challenge with most retailers reporting open slots in most stores. The challenge to keep and motivate retail associates is an ongoing one.
SALES PER SALESPERSON
The most basic measure of productivity is the salesperson. The following graphic (Graphic A) presents the recent performance. On average with all furniture store participants a level of $66,000 annually can be achieved. For the best performers the average is $74,000. The fluctuations with the larger retailer are the results of promotions.

The legendary million-dollar writer is alive and well [i]with most Best Performers having about 25% of their retail sales associates in the category. A key performance characteristic overall is the average tenure of the salesforce. Those retailers with ten years plus are typically in the top financial performance.
PERFORMANCE INDEX
The next basic measure is the performance index. Remove the debate around Ups and use the door counter adjusted down for 15% to account for the mailman and other non-purchasers and be consistent. The results should be compared to the statistics in the following.

Averaging $254 in sales per customer though the door for all retailers, Best Performance at $308 in sales per customer shows the potential. Comparing this number to the average advertising cost per Up measures your advertising performance.
SALES PER SQUARE FOOT BY SELLING SPACE
The average month translated to annual for all retailers is $219 compared to Best Performers at $249. The following graphic illustrates.

CLOSE RATE ANALYSIS
The most disputed number in our industry with excuses made for both good and bad performances is the close rate. The following graphic provides the performance.

In the past, good performance for close rate was 25%+ with an average of four stores shopped per purchase. Now, with only two stores shopped per purchase, good should be a 50% close rate. Yes, there are retailers achieving a 35% close rate.
The main point is to measures consistently and to work on incremental improvements. In our training practice we budget for a 10% improvement every year.
Footnote:
All data points are from FurnitureCore’s Best Practices application. Participants follow specific guidelines to insure accuracy of data.